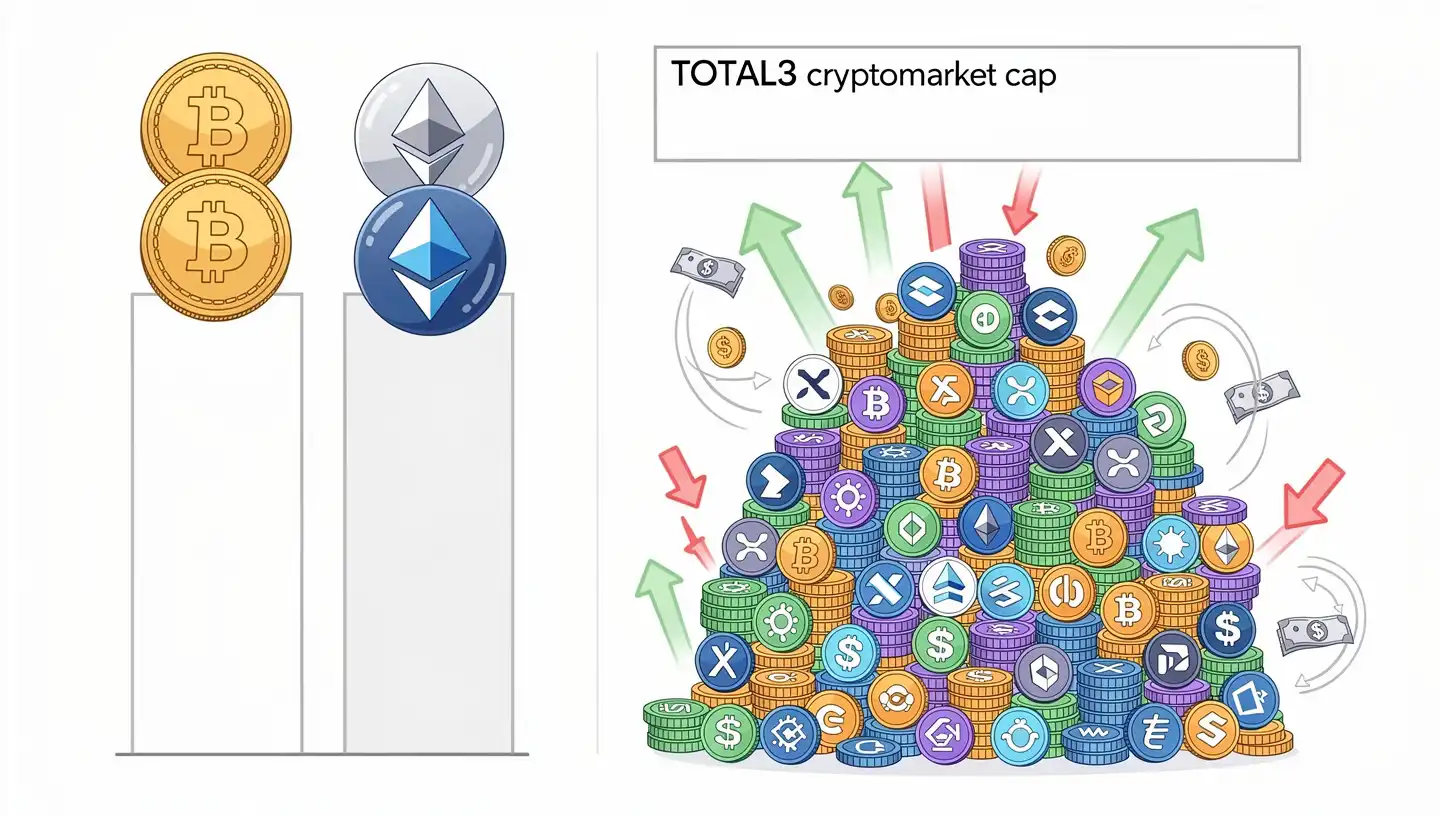
TOTAL3 is a market capitalization index that tracks the combined value of all cryptocurrencies except Bitcoin and Ethereum. It was created by TradingView and is available on the platform under the ticker CRYPTOCAP:TOTAL3. The index covers every cryptocurrency from the third-largest by market cap down to the smallest listed projects, giving traders and analysts a direct read on how the broader altcoin market is performing without the influence of the two largest assets in the space.
What is the TOTAL3 crypto market cap?
The TOTAL3 crypto market cap measures the total dollar value of all cryptocurrencies that are not Bitcoin and not Ethereum. At any given moment, it adds up the circulating supply multiplied by the current price for every qualifying asset and sums those values into a single number. That number moves up when altcoin prices rise and down when they fall, independently of what Bitcoin and Ethereum are doing.
The reason TOTAL3 exists is that Bitcoin and Ethereum together often account for more than half of the total crypto market cap. When you look at the overall market figure, the movements of those two assets dominate the reading. TOTAL3 removes that distortion and isolates the part of the market that sits beneath them, which includes mid-cap coins like Solana, XRP, BNB, and Cardano, as well as thousands of smaller altcoins and tokens across every sector of the market.
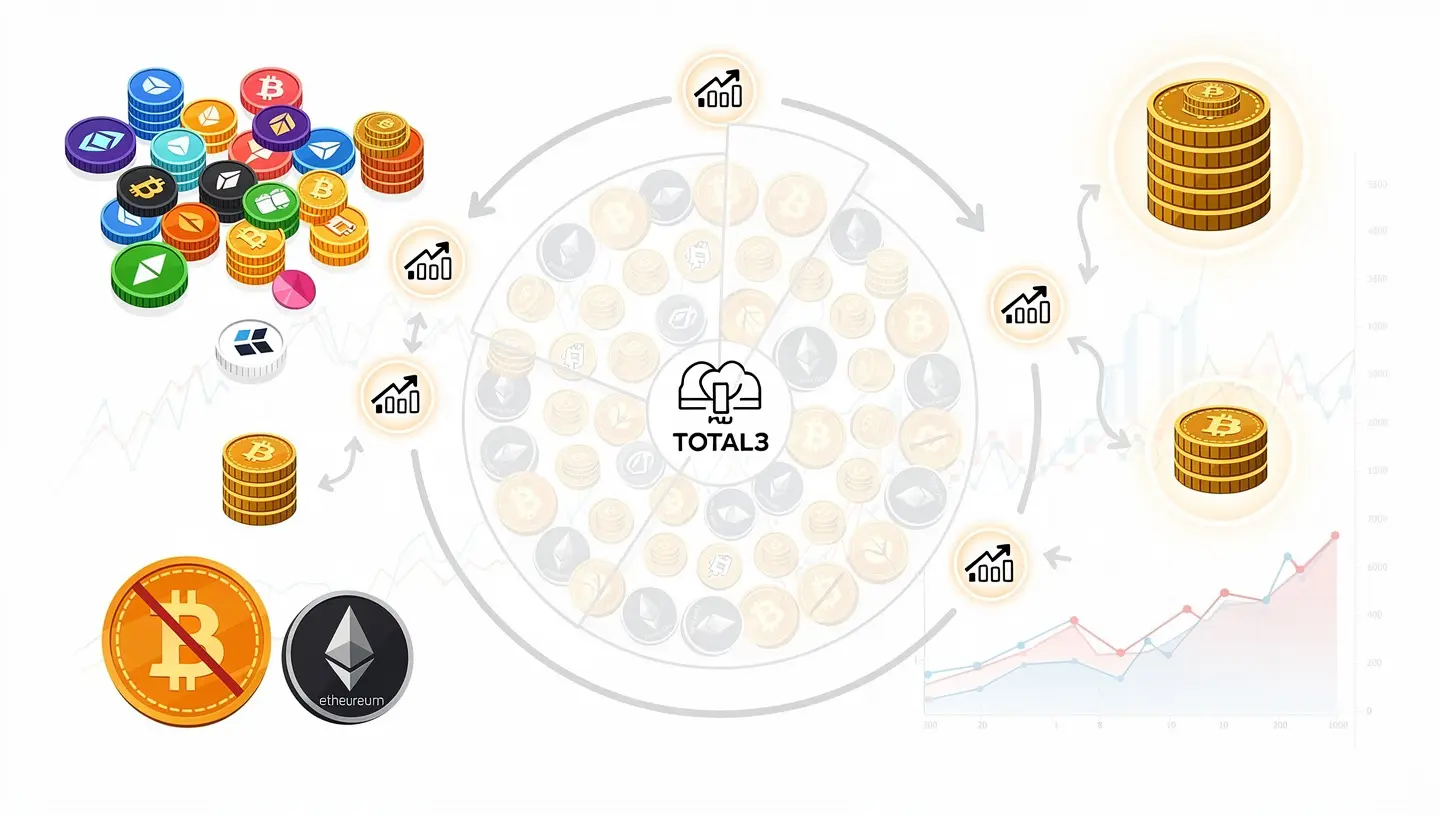
Traders use TOTAL3 primarily to answer one question: is money flowing into altcoins or out of them? When TOTAL3 rises, capital is moving into the broader altcoin market. When it falls, traders are rotating out. The index does not tell you which specific coins are moving. It tells you whether the market below Bitcoin and Ethereum is expanding or contracting as a whole. Understanding what crypto is and how it functions at a basic level helps put this kind of metric in context. That background is covered in the guide to what is crypto.
How TOTAL3 is calculated
The calculation behind TOTAL3 is straightforward. For each cryptocurrency in the index, the formula is: price x circulating supply = market cap. TOTAL3 sums those market caps for all cryptocurrencies listed on TradingView except Bitcoin and Ethereum. The result updates in real time as prices change across exchanges.
One detail that matters for anyone reading the index critically: TOTAL3 uses circulating supply, not total supply or maximum supply. Circulating supply refers to the number of coins or tokens that are currently in the market and available to trade. Tokens that are locked, vested, or not yet distributed are not included in the circulating supply figure, which means they do not count toward TOTAL3 until they are released. This distinction becomes relevant when new projects list with large fully diluted valuations but small circulating supplies, a dynamic that can cause TOTAL3 to rise on paper without reflecting genuine market activity.
The index does not filter for liquidity or quality. A coin that launched yesterday with a $10 million circulating market cap contributes to TOTAL3 the same way an established project with $10 billion does. This makes the raw TOTAL3 number a useful broad indicator but not a precise tool for measuring the health of individual altcoin investments. How crypto works at the protocol level, including how market caps are determined on blockchain networks, is explained in more detail in the guide to how crypto works.
TOTAL3 vs TOTAL2 vs Bitcoin dominance: what each one measures
TOTAL3 is one of several market-wide metrics that traders use to read different layers of the crypto market.
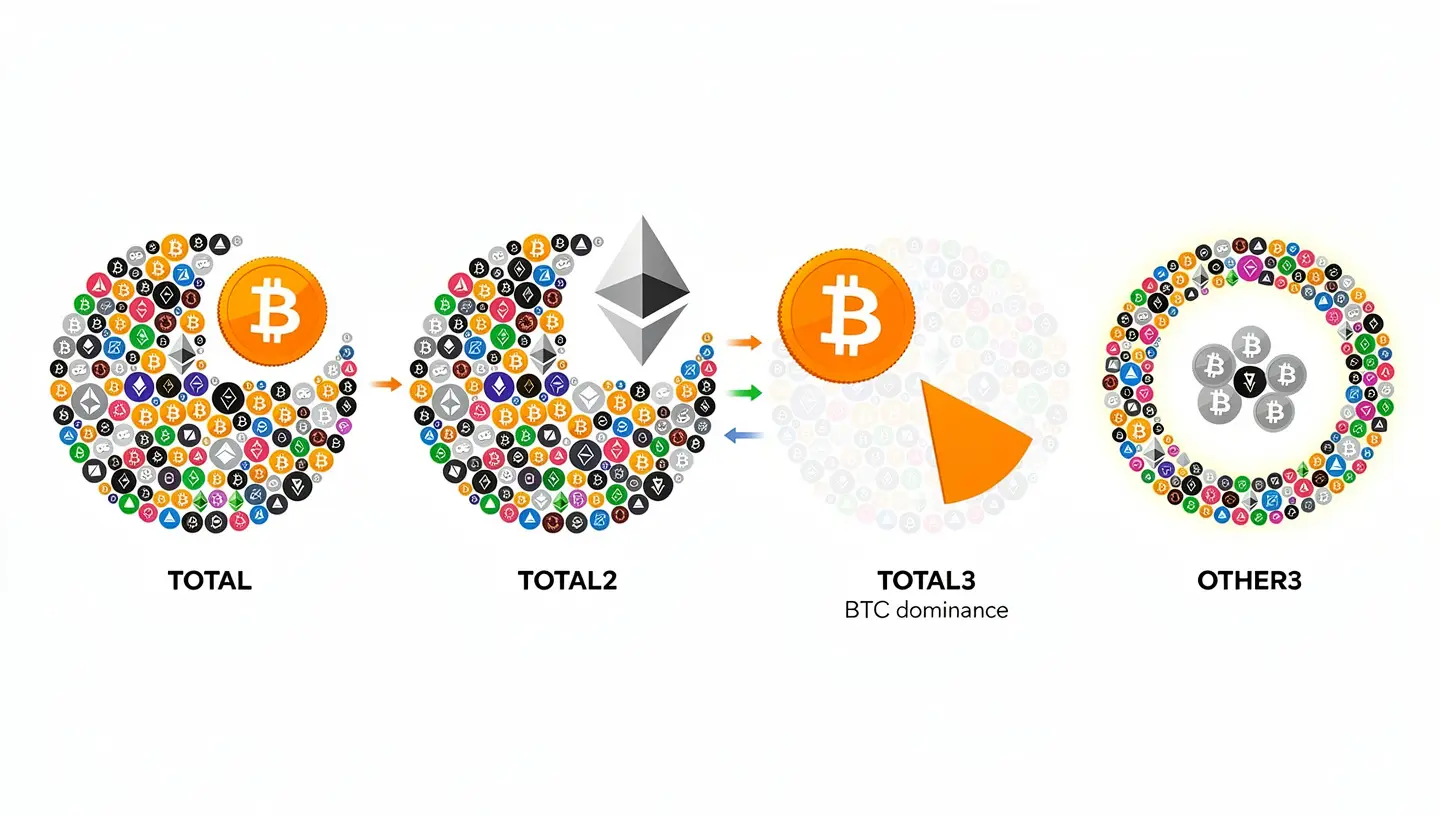
The four most commonly referenced are TOTAL, TOTAL2, TOTAL3, and Bitcoin dominance. Each one answers a different question.
| Metric | What it includes | What it measures |
|---|---|---|
| TOTAL | All cryptocurrencies | Total crypto market size |
| TOTAL2 | All crypto except Bitcoin | Altcoin market including Ethereum |
| TOTAL3 | All crypto except Bitcoin and Ethereum | Altcoin market below the top two |
| BTC.D | Bitcoin as a % of total market | Bitcoin share of all crypto value |
| OTHERS.D | All crypto outside the top 10 | Smaller altcoin market share |
TOTAL2 and TOTAL3 work as a pair. TOTAL2 shows how the altcoin market as a whole is performing, Ethereum included. TOTAL3 removes Ethereum and shows how the rest of the market is doing without it. When TOTAL2 rises but TOTAL3 stays flat, it tells you the gains are concentrated in Ethereum rather than spreading across the broader altcoin market. When both rise together, capital is flowing into altcoins broadly. When TOTAL3 rises faster than TOTAL2, it means smaller altcoins are outperforming Ethereum and capturing a larger share of market value.
Bitcoin dominance, tracked as BTC.D, is a percentage rather than a dollar figure. It shows what share of the total crypto market cap belongs to Bitcoin. A falling BTC.D means Bitcoin is losing market share to other assets. A rising BTC.D means capital is concentrating back into Bitcoin. The relationship between Bitcoin and the rest of the crypto market is covered in the guide to Bitcoin vs crypto.
What TOTAL3 tells you about the altcoin market
TOTAL3 is most useful as a directional signal, not as an absolute measure. The direction of movement, and how it compares to TOTAL2 and BTC.D, is what carries the most information.
When TOTAL3 rises
A rising TOTAL3 indicates that the combined market cap of altcoins below Bitcoin and Ethereum is growing. This can happen because prices are rising, because new tokens are being listed and adding to the total, or both. The strongest signal comes when TOTAL3 rises on high trading volume, meaning actual buying activity is driving the increase rather than thin order books being moved by small transactions. Traders read sustained TOTAL3 growth alongside a falling BTC.D as a classic early signal that capital is rotating from Bitcoin into the broader altcoin market.
When TOTAL3 falls
A falling TOTAL3 means the combined value of altcoins outside the top two is shrinking. This typically happens when traders sell altcoins and move funds into Bitcoin, Ethereum, or stablecoins. During broad market downturns, TOTAL3 tends to fall faster than TOTAL or TOTAL2 because smaller altcoins carry more risk and are sold first when sentiment turns negative. A falling TOTAL3 alongside a rising BTC.D is a risk-off signal, meaning investors are pulling back from speculative positions and consolidating into larger, more liquid assets.
When TOTAL3 rises but TOTAL2 stays flat
This is one of the more useful signals TOTAL3 produces. If TOTAL2 is not moving but TOTAL3 is rising, it means the gains in the broader altcoin market are not coming from Ethereum. They are coming from coins ranked third and below. This can indicate that Ethereum is underperforming relative to smaller assets, or that a specific narrative is driving money into lower-cap coins while Ethereum lags. Traders use this signal to gauge whether Ethereum is leading or following the broader altcoin cycle. What BTC is, how it is identified by its ticker symbol, and how it differs from other crypto assets is explained in the guide to what is BTC in crypto.
TOTAL3 and altseason: how traders use it
The term altseason refers to a phase in the crypto market cycle when altcoins, as a group, generate returns that significantly exceed those of Bitcoin. These periods are not random. They follow a pattern of capital rotation that tends to move through the market in stages.
The typical sequence looks like this. Bitcoin leads first, attracting institutional and retail capital in the early part of a cycle. BTC dominance rises. As Bitcoin consolidates or slows down, capital begins rotating into Ethereum and other large-cap altcoins. BTC.D starts falling. As that rotation continues and risk appetite increases further, money moves down the market cap ladder into smaller coins. TOTAL3 starts outpacing TOTAL2. That is the point at which traders identify an altseason in progress.
For confirmation, traders look for several signals at once, not TOTAL3 alone. A credible altseason signal typically requires TOTAL3 breaking higher on volume, BTC.D in a sustained downtrend, TOTAL2 in an uptrend, and stablecoin dominance falling, meaning money is leaving stablecoins and entering the market. When those conditions align, the probability of a broad altcoin rally is considered higher. When only one or two of them are present, the signal is weaker.
Historical cycles provide context. In 2017, Bitcoin dominance fell from above 85% to around 38% as the ICO boom funneled capital into Ethereum and new altcoins. In 2020 and 2021, DeFi and NFT activity drove broad altcoin gains as capital rotated through sectors. In both cases, TOTAL3 made significant moves while BTC.D was in decline. Bitcoin itself and its role in these cycles is covered in the guide to what is Bitcoin.
Why TOTAL3 can mislead you
TOTAL3 is a useful tool but not a precise one. Three specific problems cause it to paint a picture that does not always match what is happening in individual altcoin portfolios.
New token listings inflate the index
Every time a new token is listed on a major exchange, it joins the TOTAL3 calculation the moment it starts trading. If that token has a high price and a meaningful circulating supply, it adds a large number to the TOTAL3 total overnight. The index rises, but not because existing altcoins gained value. It rose because a new asset entered the calculation. In periods when many new tokens launch with high fully diluted valuations and limited actual liquidity, TOTAL3 can hit new highs while most altcoins in a portfolio are flat or falling. The index is counting more names, not more value in the coins that were already there.
FDV vs circulating market cap
TOTAL3 uses circulating market cap, not fully diluted valuation (FDV). FDV is what the market cap would be if every token that will ever exist were already in circulation. Many projects launch with a large total supply but release only a small percentage initially. As tokens are released over months or years according to vesting schedules, they enter the circulating supply and get added to TOTAL3. This creates a situation where TOTAL3 can grow as more tokens from a project become available to trade, even if the price of those tokens is falling. The index tracks supply expansion as well as price appreciation, which means nominal growth in TOTAL3 does not always mean the market is healthy.
Stablecoin distortion
Stablecoins such as USDT and USDC are included in TOTAL3 because they are cryptocurrencies that are not Bitcoin or Ethereum. Their market caps are significant. When fear rises in the market and traders sell altcoins into stablecoins, the stablecoin market cap grows while altcoin prices fall. Bitcoin’s share of the market also drops because stablecoins are growing as a percentage of the total. The result is that BTC.D falls, which historically has been read as a bullish altcoin signal, even though what actually happened was a flight to safety. Traders who see falling BTC.D and assume an altseason is starting can be caught off guard if stablecoin growth was the actual driver. Tracking USDT.D alongside BTC.D and TOTAL3 helps identify this distortion.
Where to track TOTAL3
TOTAL3 is available as a live chart on TradingView under the ticker CRYPTOCAP:TOTAL3. The chart shows price history, volume, and all standard technical analysis tools. You can view it alongside BTC.D, TOTAL2, TOTAL, and OTHERS.D to compare multiple layers of the market at once. There is no separate app or platform needed. Any TradingView account, including the free tier, can access the TOTAL3 chart.
A closely related variant is TOTAL3ES, also on TradingView as CRYPTOCAP:TOTAL3ES, which excludes not only Bitcoin and Ethereum but also stablecoins. TOTAL3ES shows the market cap of altcoins excluding stablecoins, which gives a cleaner reading of speculative altcoin activity without stablecoin growth inflating the number. Traders who want to avoid the stablecoin distortion problem often prefer TOTAL3ES for altseason analysis.
For anyone managing crypto across multiple wallets or exchanges, understanding the tools available for tracking the broader market is one part of the picture. The other part is knowing how your own assets are stored and secured. When you buy altcoins on an exchange, the exchange holds your private keys on your behalf. That is a convenient arrangement but it also means your access to those assets depends on the exchange staying operational and solvent. Several major exchanges have failed in the past decade, and users who kept funds there lost access for months or permanently. When you move assets to a self-custody wallet, you take full control of those keys. The differences between these two arrangements, including what each means for the safety of your funds during market downturns or exchange failures, are covered in the guide to custodial vs non-custodial wallets.
If you hold altcoins in a hardware wallet, understanding cold storage is equally relevant. Hardware wallets keep private keys completely offline, which removes the risk of remote attacks that software wallets and exchange accounts face. When the market is rising and altcoin prices are climbing, the temptation is to keep assets on exchanges for easy access. When the market turns and you need to move quickly, the security trade-offs of each storage option become much more apparent. Choosing the right type of wallet for the amount you hold and how often you trade or move funds is one of the most important practical decisions in crypto. What a cold wallet is, how it compares to a software wallet, and when offline storage makes sense is covered in the guide to cold wallets for crypto.
For those who also hold Bitcoin directly and want to understand the supply dynamics that affect its market cap, it helps to know that Bitcoin issues new coins through a mining process that reduces the reward paid to miners on a fixed schedule. That reduction is called the halving and it occurs every 210,000 blocks, roughly every four years. Understanding this mechanism explains why Bitcoin’s market cap behaves differently from altcoins with no fixed supply limits. It also explains why Bitcoin halvings attract so much attention from traders who watch TOTAL3 and BTC.D for altseason signals. A falling block reward means less new BTC entering the market, which affects the supply side of the equation that Bitcoin dominance is built on. The guide to Bitcoin halving covers the full history and mechanics of each halving event, including the 2024 halving and the one expected in 2028.
Bitcoin’s supply schedule is one of the clearest examples of how a cryptocurrency can be designed with predictable monetary policy built directly into its code. No central bank decides how much Bitcoin gets issued each day. The protocol does. Every ten minutes, a new block is added to the blockchain and a fixed amount of BTC is paid to the miner who added it. That amount has been cut in half four times since 2009 and will continue to be cut in half approximately every four years until all 21 million coins have been issued. The daily and annual figures for new BTC entering the market change with each halving, which is why traders who follow Bitcoin dominance and TOTAL3 also keep track of where the network is in its halving cycle.
The current amount miners receive per block, how that figure has changed since Bitcoin launched in 2009, and when the next scheduled change will occur are all explained in the guide to Bitcoin block reward. That guide also covers how daily BTC issuance is calculated and what it means for the total supply as it approaches the 21 million coin cap written into the Bitcoin protocol. For anyone who tracks TOTAL3 and uses Bitcoin dominance as a market timing signal, understanding the mechanics behind Bitcoin’s supply schedule adds useful context to how the overall market cap figures move over time.
Frequently asked questions
What is TOTAL3 in crypto?
TOTAL3 is a market capitalization index created by TradingView that tracks the combined value of all cryptocurrencies except Bitcoin and Ethereum. It is available on TradingView as CRYPTOCAP:TOTAL3 and updates in real time. Traders use it to track how the broader altcoin market is performing independently of the two largest cryptocurrencies.
What is the difference between TOTAL2 and TOTAL3?
TOTAL2 tracks the market cap of all cryptocurrencies except Bitcoin, so it includes Ethereum. TOTAL3 tracks the market cap of all cryptocurrencies except both Bitcoin and Ethereum. TOTAL3 is therefore a narrower index that isolates the performance of mid-cap and small-cap altcoins. When TOTAL3 rises faster than TOTAL2, smaller altcoins are outperforming Ethereum.
Is a rising TOTAL3 always bullish for altcoins?
Not always. TOTAL3 can rise because altcoin prices are going up, but it can also rise because new tokens with large valuations are being listed, adding to the index without existing prices improving. Stablecoin market cap growth can also contribute to a rising TOTAL3. A rising TOTAL3 is most meaningful as a bullish signal when it is accompanied by rising trading volume, falling Bitcoin dominance, and falling stablecoin dominance at the same time.
What is TOTAL3ES?
TOTAL3ES is a variant of TOTAL3 that also excludes stablecoins such as USDT and USDC from the calculation. It is available on TradingView as CRYPTOCAP:TOTAL3ES. Because stablecoins can grow during periods of market fear and inflate the raw TOTAL3 number, TOTAL3ES gives a cleaner reading of speculative altcoin demand by removing that component entirely.
How does TOTAL3 relate to Bitcoin dominance?
Bitcoin dominance (BTC.D) and TOTAL3 tend to move in opposite directions during an altcoin season. When BTC.D falls, Bitcoin’s share of the total market is shrinking, which often means capital is rotating into altcoins. A rising TOTAL3 alongside a falling BTC.D is one of the most widely used signals that an altseason may be underway. However, BTC.D can also fall because of stablecoin growth rather than altcoin gains, so both metrics need to be read together rather than in isolation.
What was TOTAL3 in previous market cycles?
TOTAL3 reached a significant peak in late 2021, during the period when DeFi and NFT activity drove broad altcoin gains and Bitcoin dominance fell toward 40%. That 2021 peak became a key resistance level that TOTAL3 tested multiple times in 2024 and 2025. Comparing the current TOTAL3 reading against historical levels gives traders a frame of reference for where the altcoin market stands relative to prior cycle highs.
Sources
- CRYPTOCAP:TOTAL3, TradingView
- What Is Altcoin Dominance and How to Identify an Altseason, CoinGecko Learn